-
- 07 Mar
Is the Boom already becoming a Bust and are we Prepared?
This paper is a shortened form of a public lecture in May-2012 by Ian Runge at the invitation of the University of Queensland School of Economics. The objective was to examine the state of the (then) current resources boom, and to highlight actions that might forestall any subsequent bust. Compared to the public lecture, this paper omits some non-essential examples and some background information.
Summary and Outline
China joined the World Trade Organization a little over a decade ago, and the subsequent expansion in manufacturing and trade that this set off has led to one of the most significant booms in history. The boom has been particularly noteworthy in the resource industry where the increased demand for commodities to fuel the Chinese economic expansion has led to the greatest expansion in mineral production in decades. Now, with some decline in commodity prices already evident, questions are being asked about the sustainability of the boom, at least from being underpinned by Chinese demand. This paper examines this aspect and presents the view that:
- The best parts of the boom are definitely behind us,
- There is no bust yet. On past history, a bust is the most likely outcome, but every cycle is different and there are reasons and some hope that this time around this won�t be the case. The paper argues why a bust is, or normally is, the most likely outcome, and I�ll outline some things we can do to avoid or mitigate it.
- On the subject of �are we prepared?� this paper argues the answer is a qualified �no.� At the corporate level of companies there is definitely more alertness than in previous cycles, but at an operational level the industry has been so focused on production for so long that the transition to economics, and economic efficiency as the key driver for our choices will be a difficult one.
The paper uses some simple tools of economics. I don�t make any apology for this � in the last half-century a lot of people have lost a lot of money because of a failure to understand the fundamental economics of the industry � my mission is to help the industry avoid such an outcome this time around. You don�t need sophisticated mathematical economic models to do this, but you do need at least some of the simple tools of economics.
Is the Boom already becoming a Bust?
Up until 2007 or 2008 the world in general was enjoying relative boom times, supported by lower cost imported goods from China. Since then this other world has been in a fairly serious down-turn. Not so for mining. Aside from a little blip in 2008, for the last decade or so the resources industry throughout the world has been enjoying boom type conditions. It is this �boom� that I refer to in my title whose continuing strength I question.
The current resources boom is not unconnected with the �other� boom/bust (now referred to as the Global Financial Crisis), so to answer the question in the title requires understanding the state of play of the economic cycle everywhere else in the world. In the last 40 years we in the mining industry have been through half-a-dozen booms and busts, and these tend to impact us harder than most other industries. Thus my perspective on booms and busts is somewhat different to the perspective of most other commentators.
Key Features of Boom/Bust Environments
There are common elements to most business cycles, but the world economy is not �cyclic� in the sense that it is pre-ordained to oscillate up and down like some cosmic sine wave. Everything has a cause or multiple causes. Economic cycles always have more than one element, because if there was only one element the cause would be relatively easy to isolate and understand and probably the cycle wouldn�t eventuate in the first place.
Most boom-and-bust cycles comprise at least 3 elements:
- Something that changes the structure of production. To get a �boom� you nearly always need some new or breakthrough technology of some sort that substantially alters the cost of production or our way of doing business. It will have real and widespread benefits, but it will also result in a certain amount of �creative destruction.�
When the motor car displaced the horse and carriage as the main mode of transport, all the infrastructure associated with horses became less valuable and people with horse skills were worse off and had to adapt.
In the current cycle the breakthrough thing that is altering our structure of production is the emergence of Chinese manufactured goods on the world markets. Previously untapped low-cost resources in China are now being made available within the broader world economy.
- There is the influence of the capital/finance markets, or more broadly speaking, the money supply. �This role can be an heroic one, a villainous one, or neither, but it is always the transmission mechanism.� For something to be global, there has to be an input that affects everybody or nearly everybody. And that input is money. �In other presentations and papers I have used the term �ill-disciplined sources of finance� and poor discipline on the finance side is a characteristic of just about every boom/bust fluctuation I have studied. But conceptually you just need finance as a player � it doesn�t necessarily have to be ill-disciplined. �The current cycle has certainly been characterized by poor discipline on the finance side. �Starting with distortions in the US sub-prime housing market the distortions continued through financial instruments that took risky assets and dressed them up to look less-risky. Finally these financial instruments were sold all around the world ensuring that their negative effects were transmitted around the world. �Most commentators lay the blame for the global financial crisis on these finance and money elements. I don�t think it is so clear-cut, but this is a discussion that will take more time to pursue than available in this paper/presentation.
- Institutional influences. Booms and busts cannot be properly understood without considering institutions. �Institutions are the framework or rules upon which economic activity is conducted. The term is used here in the broadest sense � in this context �institutions� does not mean just governments. Regulations, the inadequacy of them, or the distortions caused by them, certainly play a role. So do traditions, morals, ethics, and cultural elements. �Institutions tend to be conservative elements. �Time honored� traditions govern a lot of what we do, and if the new technology requires us to do things differently, we give up these traditions only reluctantly. Government regulations are always framed around current or previous environments and invariably will be found wanting in new or changed environments.
When the pendulum clock was invented in the mid-1600s, it seriously challenged the power of the church which, through controlling the (previous) sun dial and water clock also controlled village life through the ringing of the bells. After the invention of the pendulum clock village life was a lot less constrained by these rituals. From history, the churches resisted the introduction of the pendulum clock for over 100 years.
I use this example to put into perspective comments we hear today. It is easy to blame booms and busts on government influences and on the failure of government regulations but if we stop there we assign ourselves too easy a task.
How these institutional forces play out is a primary determinant of how quickly or easily the economy gets through the adjustment period.
Elements of the Current boom-and-bust cycle
Now I will look at a couple of these elements in more detail.
China joins the World Trade Organization
The world has been trading with China for a long time, but the key date for the current boom was when China joined the WTO. It is easy to forget that this was scarcely more than a decade ago.
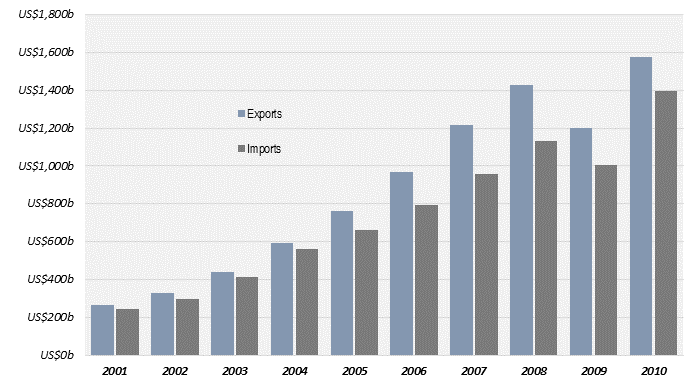
Figure 1 – Chinese Exports and Imports since 2001
Since 2001 Chinese trade with the world has grown dramatically. China�s top ten exports include electrical equipment, apparel, furniture, and footwear and there have been dramatic reductions in the costs of these goods throughout the world.
In a world economy undistorted by other influences, throughout the mid-2000s the consumer price index in most countries should have gone down. Yet this wasn�t the case.
Influence of the Finance Markets and the Money Supply.
In past boom-and-bust cycles, money supply growth has often been the cause of the boom, and contractions in the money supply the cause of the subsequent bust. However in the relatively open economies of the advanced world artificial changes like these do not have the same effect as in past eras. The various central banks throughout the world have been attempting to induce investment and stimulate their economies, but to little effect. In most open economies artificial measures such as these only lead to higher inflation, higher interest rates, lower exchange rates, or some other impact that counterbalances the effect that the measures are trying to bring about.
Ordinarily, the growth in money supply that occurred through the 2000s would have resulted in very substantial inflation. However, on the consumer goods side, there have been real reductions is the price of goods sourced from China. The net effect has been very mild inflation when measured by the CPI. Remember that �CPI� relates to consumer goods, not capital goods or non-consumer assets such as equities, collectables and the like. This influence (of declining prices of consumer goods sourced from China) masked the underlying impacts of the money supply growth that would have otherwise been much more evident. The non-consumer-goods part of the economy has had very substantial inflation � property, equities, and commodities where the distortions are most pronounced.
So, to recap: during this period the world economy had to accommodate a new big, well-resourced competitor who was undermining the competitiveness of some of our traditional industries. The correct reaction to such increased competition should have been to reduce consumption until we adapted by directing resources into areas that were not as competitively susceptible. However in most of the world consumption was not cut back. In the USA consumption was maintained by refinancing property, whose value was increasing due to the growth in money supply.
During the height of the US housing re-financing period, borrowers were extracting between $600 billion and $800 billion per year from their homes � and using it for consumption. $600 billion represents around 8% of US personal consumption expenditures. Over a period of several years leading up to 2008 people in aggregate were spending in the order of 5% to 8% more on consumption goods than they really should have based not on their ability to fund, but on the artificially inflated and distorted value of their homes.
This, in a nut shell is how I see the global economy today. The economy is distorted and requires adjustment not just due to the financial misallocation of resources but also due to the changed structure of production throughout the world. This is why the rebound is turning out to be slower than many commentators originally predicted.
In summary:
- There have been real losses (house values previously inflated are now worth less, the value of businesses competing with Chinese suppliers are now worth less) and this value is gone forever.
- Consumption expenditures throughout the mid-2000s were higher than we �really� wanted to make. Due to distorted signals through the financial markets we maintained a lifestyle that didn�t reflect the new, more competitive world economic order.
- So (since 2008) ordinary people have cut back consumption and are saving (de-leveraging) to get intertemporal valuation back in balance.
The countries that are doing better than others are the ones with open economies that were forced to confront the issues right from the start and whose institutions facilitate change � USA for example. The countries that are not doing well are the ones whose institutions resist change. Europe and Japan, for example. Some countries and people like Australia and Germany have not been hit so hard, because the disruption of competing industries has been counterbalanced by sales to China � in Australia�s case in mineral commodities, in Germany�s case in machine tools for Chinese factories. But in all countries regulatory reform and fiscal reform lags the real economic order.
It is fortunate for Australia that we do have this commodities export safety valve, because in my judgment the institutional structure in Australia (regulations, cultural issues, and the Australian political environment) is one that is quite resistant to change.
If you agree with my assessment, then the scenario we face is still a quite bullish one. The really big economies and the growth economies are emerging in pretty good shape � USA, Germany; and of course the Chinese economy itself. There are some other sizeable players who are also in reasonable shape � India, South East Asia, Australia.
There are some short term issues in all countries, but in my assessment the prospects and overall growth in demand for commodities does not leave me too concerned. If the boom is to become a bust, I don�t think it will be due to any precipitous drop in demand.
So much for the more �optimistic� component of this paper/presentation.
Supply / Demand Characteristics
In my experience, at least for bulk commodities, busts in the mining industry have never been caused by demand issues. They are always initiated from the supply side. If there is going to be a bust, then it will be the result of supply growth outstripping demand growth, resulting in declines in commodity prices necessary to clear the market. The balance of the paper examines this scenario.
Establishing the Long Term Commodity Price
Consider for example the iron ore sector. There has already been a lot of new production capacity committed. How does a company in the business rationally decide what the future price of iron ore will be through the life of the proposed mine? If the mine life is to extend over 15 or more years, then logically the selling price estimate should cover a similar time frame.
Figure 2 shows the price of iron ore over the 6 years to April 2012.
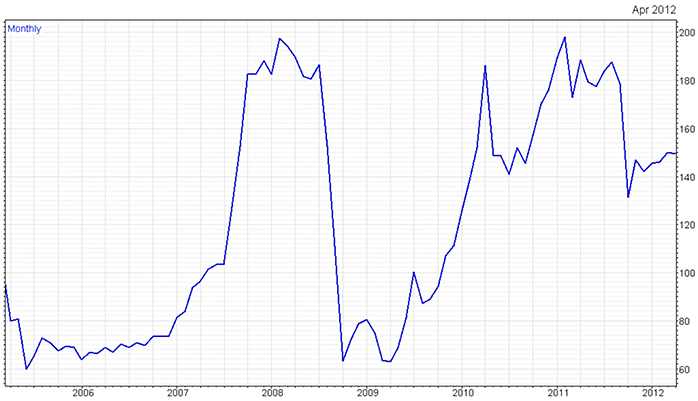
Figure 2 � Huge Variability in the Iron Ore Price; What Price should the Assessment Use?
If you were a senior manager in a mining enterprise undertaking a feasibility study for a new iron ore mine development what price of iron ore would you insert into your spreadsheet? The huge variability in price over the previous 6 years provides little comfort in establishing a basis for price estimates over the ensuing 15 or more years of life of the project. Price charts on their own provide limited guidance.
Many practitioners regard the supply-demand chart to be a more helpful tool as guidance for the long term supply/demand balance. If a new project can yield a fair return at the long term equilibrium price, then this seems to be a more reliable foundation to underpin a multi-billion dollar investment on.
Figure 3 shows one estimate, undertaken in 2012, of the projected supply cost for Iron Ore production in 2016. In this figure, each block represents one supplier. Long term costs of production can typically be well defined in advance since most elements of the cost of production are well defined in advance � e.g. depth of orebody, waste: ore ratio, grade of the ore, transport distances etc.
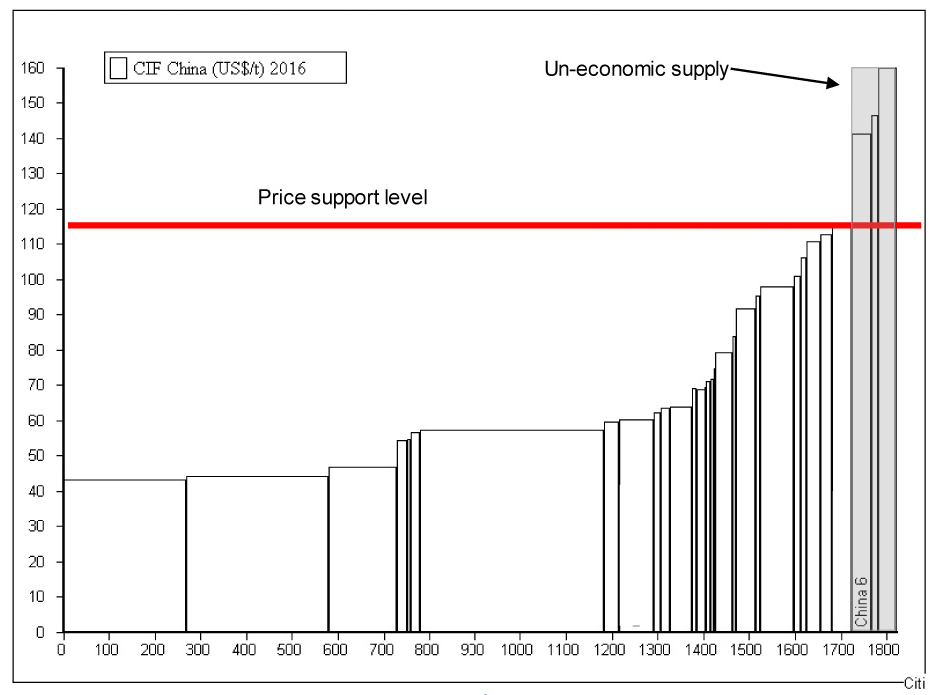
Figure 3 – Iron Ore Supply Cost-of-Production Curve (estimated costs in 2016)1
The use of curves similar to Figure 3 is common in the industry. In this figure just four major producers account for about 60% of production. This situation is not atypical for bulk commodities � the bulk of production is sourced from a relatively few producers whose costs are substantially below the estimated long term (equilibrium) price. The implication is that in the event of price declines these big producers will continue to produce at a profit, and supply/demand imbalances will be borne by smaller, higher cost producers who will presumably stop producing once the market price is less than their cost of production.
If equilibrium prices could be reached quickly (i.e. a short time compared to a typical project life) then a static general-equilibrium model such as Figure 3 would be more useful. However this is not the case with mining investments, so some other model is called for. For the mining industry, it comes down to supply growth outpacing demand growth.
Impact of Growth in Supply outstripping Growth in Demand
In any industry it is the low cost producers � or, the producers with the lowest marginal cost of production � who have the greatest economic incentives to expand. On the demand side, the same economic forces prevail: the most efficient producers in their market are the ones who have the greatest economic incentives to expand, and these are the ones least sensitive to the price of their raw material inputs. The market price is not determined by either of these entities, it is determined by producers and consumers at the margin. Figure 4 shows a supply curve modeled along the same lines as Figure 3, matched up with the �mirror� equivalent on the demand side, and the multiple lines represent movement of these supply and demand curves under a growth scenario. In this figure, the demand curve grows at 5% per year, whilst the supply curve grows at 10% per year. The coloured dots indicate the price where supply balances demand.
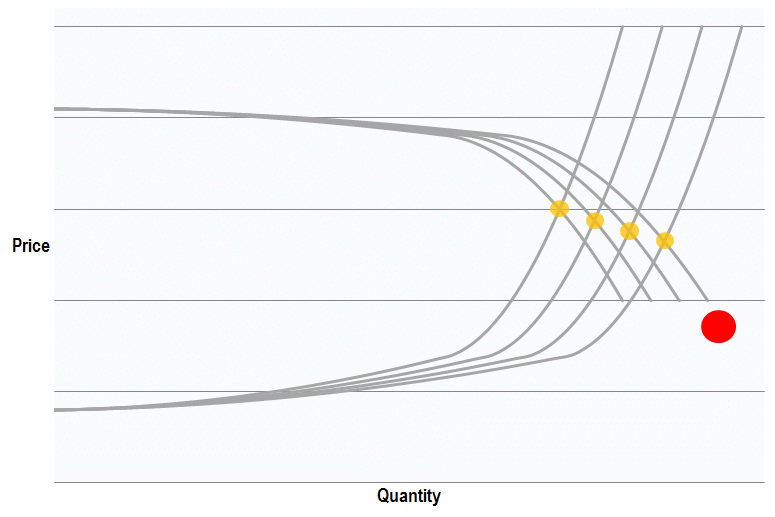
Figure 4 – Supply-Demand Balance under Different Growth Rates
Because of the shape of the curves, if the growth of supply is only slightly more than the growth in demand this results in substantial falls in the market clearing price. The end result is record production but at a price settling on the big red dot.
The economic structure of most of our projects almost guarantees that supply growth will outpace demand growth � even in the face of declining prices.
Why Supply keeps Expanding even when Prices are falling.
To understand why mining expansions continue apace even in the face of declining market prices, it is necessary to understand the differences between mining investment decisions and the decisions of conventional economic theory (in consumer markets, for example).
Difference between Mining Investments and Other Investments
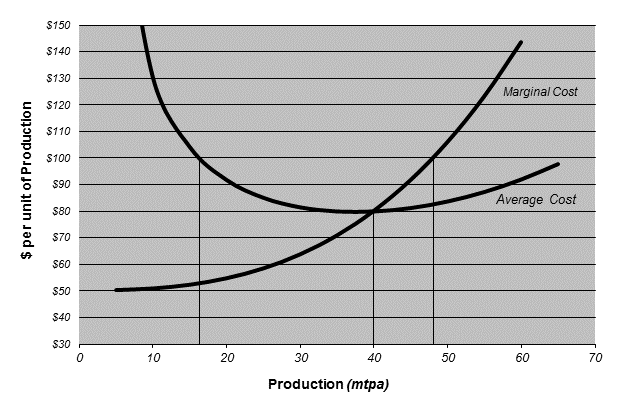
Figure 5 – Optimum Production Rate Curve in a Simple World
Consider first the simple case from economic theory shown graphically in Figure 5. The production rate with the lowest average cost occurs at 40mtpa and an average cost of $80/tonne. If everyone has similar costs, then ultimately the �equilibrium� market price will settle at this average cost. If the current market price is $100/tonne then the project can be developed initially (and yield an above-market return, at least for a while) at production rates from 18 mtpa through to 48 mtpa.
In a contestable market:
- prices will adjust quickly to an equilibrium price. If any producers attempt to maintain an �above equilibrium� price then new entrants (competitors) will be able to start using the same technology as existing producers, sell their product at a price less than the existing market price, and still make a profit.
- any one project investment can assume a single price because sales are into a world market where the output from any one project is unlikely to affect the price.
- When competition shakes out inefficient competitors, supply from these producers gets taken off the market, and the equipment and resources associated with this supplier gets deployed elsewhere.
The world of large scale mining investments doesn�t fit this contestable model very well. In mining;
- every investment involves some proprietary input � the orebody � so your costs can be quite different to other suppliers costs. New competitors may not be able to start-up and undercut your price because they don�t own this key input (the orebody).
- whilst mining enterprises sell their products into a competitive market, they are not selling identical products. Similarly, customers have limitations on the kinds of products and the proportions of products that can be accommodated. In the long term these differences will adjust, but at the time of commitment for a large scale mine, producers are facing a downward sloping demand curve. The optimum production rate calculation cannot assume a single price for the product.2
- It costs a lot of money to drill out and evaluate a deposit. The costs of information are endogenous to the process � it is much less cost to do this once the mine is in operation.
There is of course a minimum production rate that you can start-up a mine at � this being the one that covers the capital establishment cost.
About Classically Well-Managed New Mining Investments
Most well managed mining enterprises:
- Aim to start up a mine at a rate that is substantially less than the optimum rate for that deposit when analyzed using simple economic models, and
- Provide for options to change (Real Options) � particularly the option to expand.
- The real option to expand also serves another purpose. There are things that you don�t know enough about now, but you know that, once you get going you will know enough about � the scope to expand lets you capitalize on this value.
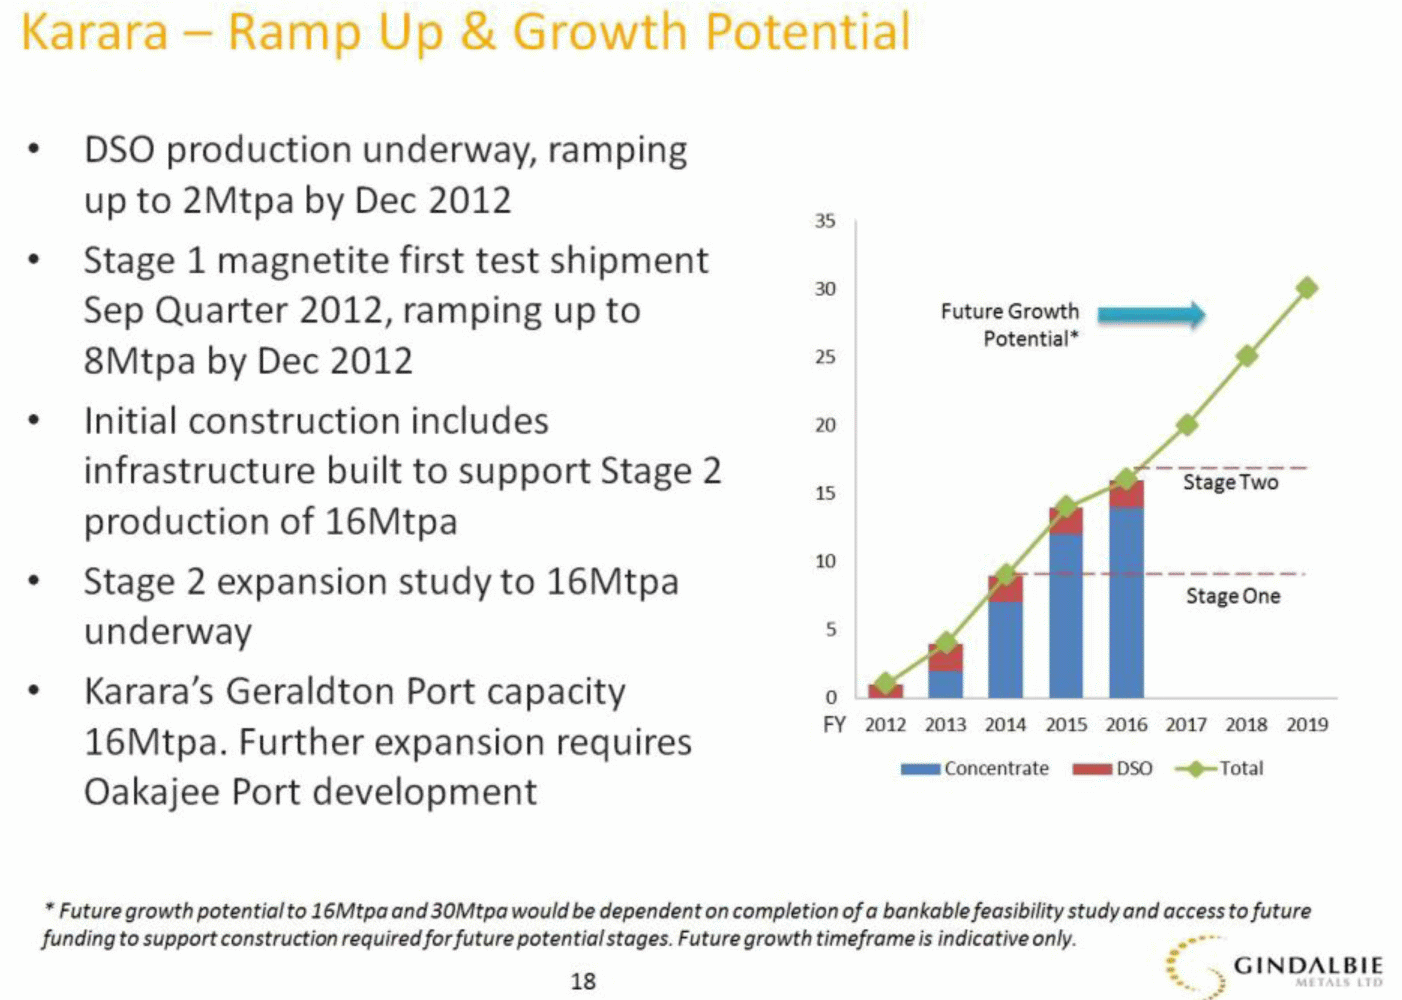
Figure 6 – Press Release – Mine Start-up with Potential for Expansion
Figure 6 shows part of a press release associated with the Karara Iron Ore Mine near Geraldton in Western Australia to highlight this characteristic.
This press release indicated no commitment to expand the mine (to 16mtpa) yet indicated that the initial commitment (for 8mtpa) included some costs of infrastructure for the expanded case. The initial commitment included a Real Option to expand. Most large scale mines are planned similarly, and rightly so, because the initial production rate is sub-optimum for the size of deposit. The result is that the marginal cost of the expanded production case will be lower than the average cost of production for the initial case.
How Should Mining Companies respond to Cost Pressures (Declining Commodity Prices)
The mining industry is now coming out of an era of project development, with high commodity prices, and a production focus. The new era is one of lower prices, and an economics or efficiency focus. Well managed companies will be asking their planning engineers to look for efficiencies.
What should their recommendations be?
There will always be some obvious actions. Once into production, the deposit and its metallurgical characteristics will be much better known, both from a mining characteristics, ore treatment, and market acceptance point-of-view. Initial actions involve de-bottlenecking, for example, where some components of the original development turn out to be undersized.
However the overwhelming factor leading to improved mine economics will be the low marginal costs of expansion.
If selling prices are sustained what is the most economical plan? �.. expand
If selling prices decline what is the most economical plan? �.. expand
Even if you are making losses what is the most economical plan? �.. expand (probably)
This is the producer�s dilemma. The environment is one where prices are declining due to over-supply, and the apparent best response is to expand – which will result in even more over-supply. And all of the competitors in the market face the same dilemma.
Even if the dilemma is considered strategically a similar (bad) result follows. By �strategically� I mean pausing to consider not just your own best economic choice, but to also consider the expected actions and reactions of others in the market place. Figure 7 shows the classic Prisoners Dilemma3 Model adapted for the declining commodity price environment.

Figure 7 – Producers Dilemma � Rational Managers expand Production to their own Detriment
- The best outcome for a producer is Quadrant 1 or 3: so long as everyone else doesn�t expand (the left-side figure) the supply curve will not be significantly impacted. If you expand (Quadrant 3) the price might come off a bit, but your increased volume at low marginal cost will more than compensate.
- However this outcome (everyone else not expanding) isn�t realistic because the biggest competitors have similar economic structures, and their best option is also to expand (but always hoping that everyone else won�t).
- If everyone expands production (the right-side figure) the price will fall substantially, and every producer will be worse off than if no producer expanded production.
- The worst case (for an individual producer) is Quadrant 2: to show restraint (i.e. to not expand your own production) whilst all of your competitors are expanding theirs. The result will be lower selling prices for your production without the higher volumes to offset [your] fixed costs.
Thus mining companies looking to improve the efficiencies of their operations will invariably focus on expanded production because even with low prices the marginal cost of expanded production is likely to be less than the market price.
Expanded production will depress prices further.
Where Did the Resources Industry go Wrong?
With the economic structure of most large scale mines and choice under the producer�s dilemma model, the dominant strategy is to expand, even in the face of declining prices. This is almost destined to happen. The supply side of the industry will itself be promoting and prolonging the bust and left wondering what went wrong? Let�s fast forward to this future world to see where things did go wrong:
- Pricing assumptions in mine feasibility studies were, or have been, relatively conservative � projects in general have only been commenced if they were viable at a long term supply/demand equilibrium price
- Known resources have generally not been over-committed – deposits can generally sustain mine developments with much higher production rates than have been used in the �base case�
- Mine plans generally incorporate Real Options to change (particularly, to expand)
- As soon as mines are in production optimization studies are undertaken, looking to find how best to run the mine for maximum efficiency. These studies will unambiguously suggest the most economical approach was/is mine expansion.
- For companies that think �strategically� – taking into account the possible actions and reactions of other suppliers/customers � the dominant strategy remains �to expand.�
The result is that a �bust� cannot be avoided, with depressed prices, an oversupplied market, and poor returns to investment.
Are We Prepared?
At the start of this paper I stated that, based on past history, a bust is the most likely outcome. However every cycle is different. What are the reasons that this time around a �bust� won�t be the case?
Preparedness at a Corporate Level
Consider some of the things that differentiate this mining boom from the last couple of booms in the major bulk commodity markets. In particular, I use the example of the major coal boom in Queensland and NSW in the 1980s.
- Up until the current era Australian miners have always been undercapitalized in comparison to the capital requirements and perceived risks of the projects they were undertaking. At least with our biggest miners now that is not the case. Being under-capitalized in a down-turn is not a good place to be – your options and staying-power are much reduced.
- As a result of this, the ownership of mines in the past commonly included customers and/or trading houses. These partners (mines were generally developed at Joint Ventures) commonly provided finance and offtake guarantees which were used as a risk mitigation mechanism. The involvement of such partners was often required by 3rd party financiers to get their support. This creates a distinct conflict of interest. If a customer is a part owner, does his interest lie in high prices (to get a better return on his mining investment) or in low prices (to reduce his supply cost)? In some cases these JV partners/owners actually benefitted from low prices � the lower return on their investment was more than compensated for by the lower cost of the commodity they were buying.
- Other powerful players (such as Government-owned Railways and Ports operators, and the trading houses themselves) made their returns based on tonnage throughput rather than the profitability of the mines, and therefore were happy to promote over-production.
- When oil companies entered the coal industry in a big way, the effect of their inexperience in mining PLUS their deep pockets (that ill-disciplined source of finance again!) combined to promote over-investment, over-production, and industry cost structures that undermined industry economics. Whilst there are other deep-pocketed inexperienced players now, this influence is not as significant in the current cycle.
- Some domestic producers pursued marketing strategies aimed at advancing their own agenda deliberately at the expense of other producers � but where the net result harmed all producers including themselves and benefitted only customers.
Most of these components are less significant now. Thus, from a corporate perspective, the industry has fewer obstacles this time around to avoiding the worst of the �bust� scenario.
Preparedness at an Operational Level
At an operational level, the industry is distinctly under-prepared.
The mining industry is now coming out of an era of project development and production focus, into an era of economics or efficiency focus. Can we make the transition?
�Tonnes produced� is easy to measure. �Opportunity Costs� cannot be measured. �Marginal Costs� are a planning tool to help us make better choices, and although they can often be calculated they too cannot be measured. If you belong to the school of thought that says �if you can�t measure it, you can�t manage it� then the transition into this new era is going to be a difficult one.
A production operation requires a different culture than one with an efficiency and economic focus. Can the change be engineered without commodity prices first falling through the floor? From experience I�d say �no�
Using Economics as a Tool to help with Improved Efficiency
�Economics� is not something that people intuitively understand. Worse, most production-focused people eschew the idea that much economic thought is even meaningful. Economists have done themselves a great disservice over the years.
Economics is a tool for understanding how the world works. You can use the tools in lots of ways. I hope in this paper I have done this to further your understanding of the economic structure of the mining industry. The famous (or, in some circles, infamous) economist John Maynard Keynes once observed that �practical men, who believe themselves to be quite exempt from any intellectual influences, are usually slaves of some defunct economist�
We in the mining industry like to think of ourselves as the archetypal �practical men� that Keynes refers to. We are entering a new era in our industry now when we need the skills of economists whether we believe ourselves exempt from their intellectual influences or not. I commend this to you, and maybe the �bust� will never materialize.
1Figure adapted from a paper: Iron Ore Market Outlook, prepared by Citi Investment Research & Analysis for the Global Iron Ore and Steel Forecasting Conference, 2012
2The optimum production rate to start up a mine is less than the optimum production rate from the same mine once it has been operating for some time.� This characteristic of the mining investment was addressed in my keynote paper Economics of Mine Planning and Equipment Selection in �MPES 2010� AusIMM, Melbourne, 2010.
3 The �Prisoners Dilemma� is a classical model used extensively in the economics field to explain actions and reactions of economic players in a game theory context.
About the Author
IanRunge
https://ianrunge.com

